Unveiling Hidden Realities: Shedding Light on Human Trafficking in Alberta
Leveraging Data for Good: My Volunteer Contributions to Policywise
Table of Contents
∘ Introduction
∘ Why I Joined the Alberta Human Trafficking Data Portal Project
∘ Contributions and Analysis
∘ Conclusion
Introduction
I had the honor of collaborating with Policywise on an initiative sponsored by Not In My City aimed at combating human trafficking in Alberta as a volunteer at Data for Good. Our shared objective was to develop a dashboard that would provide valuable insights into the prevalence and trends of human trafficking within the province.
Why I Joined the Alberta Human Trafficking Data Portal Project
Human trafficking is a devastating crime that impacts millions worldwide. It entails taking advantage of helpless people who are coerced into labor or prostitution against their will. The sensation of having their freedom and dignity taken away is typical among human trafficking victims, who come from many walks of life.
Imagine being deprived of all you know and love and compelled to work in perilous situations without escape. Many human trafficking victims experience this awful scenario because they are frequently misled by promises of a better life and forced into misery and pain.
There is no consensus about the real magnitude of the issue but the fact that each number represents a lost human life is what matters. Whether where we live is a source, destination, or transit location for trafficking, it occurs on every continent and practically every nation.
This problem’s sheer magnitude can make people feel hopeless, discouraged, and profoundly shocked. It is important to keep in mind that every victim of human trafficking is someone’s family or friend and just like the rest of us, they have goals and dreams, but the cruelty of others has irreparably damaged their lives.
The pressing imperative remains and mandates that we, as a global community, must do everything to eliminate this crime. Millions of people caught in this cycle of exploitation can change their lives if we raise awareness, fund anti-trafficking organizations, and advocate for stricter laws and regulations.
Human trafficking is more than a statistic or a news headline. They represent humans who have faced inhuman conditions that need our attention and response. Let’s join hands together to end this heinous crime and create a culture where everyone can live with dignity and respect.
Contributions and Analysis
The following represents my contributions to the project as a volunteer at Data for Good for Policywise.
I provided critical recommendations to Policywise stakeholders regarding the secure dissemination of data on human trafficking victims in Alberta. Recognizing the sensitive nature of this information, our team conducted a comprehensive analysis of data-sharing practices and risks. By identifying potential vulnerabilities and proposing robust security measures like publishing aggregated statistics, preventing residual disclosures, ensuring a secure process for granting access to granular confidential data to prevent exploitation from bad actors, and routinely auditing their server logs for unusual activities, we made sure that the dissemination of data was carried out with the utmost care and consideration for the privacy and safety of human trafficking victims.
The following analysis offers a thorough look at the documents connected to human trafficking in Alberta based on official data sources provided by Statistics Canada, which primarily focused on the most recent five-year period (2017–2021) since the quality of data for previous years is sparse and cannot be relied upon for accuracy. [Data Source: Statistics Canada Table 35–10–0177–01 Incident-based crime statistics, by detailed violations, Canada, provinces, territories, Census Metropolitan Areas and Canadian Forces Military Police]
The study intends to investigate real cases of human trafficking, the incidence rate per 100,000 people, the percentage change in incidence rates, and the number of reported cases later determined to be unfounded over the given period. I have created and deployed this as a dashboard powered by Streamlit and Altair.
The trend of actual incidents of trafficking in persons in Alberta from 2017 to 2021
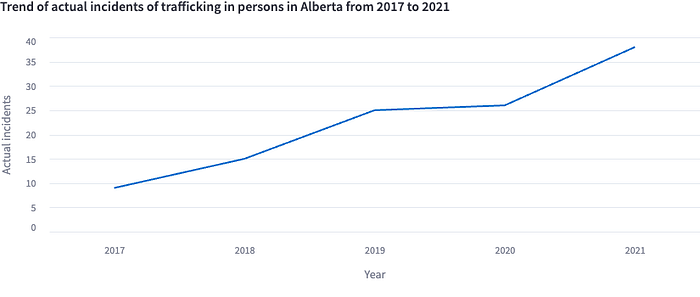
The above chart illustrates the trend of actual reported Human Trafficking incidents in Alberta which has been on the rise since 2017.
actual_incidents_chart = alt.Chart(data).mark_line().encode(
                         x=alt.X('REF_DATE:N', axis=alt.Axis(title='Year', labelAngle=0), sort=None),
                         y='Actual incidents',
                            tooltip=[
                                alt.Tooltip('REF_DATE:N', title='Year'),
                                alt.Tooltip('Actual incidents', title='Actual Incidents')
                            ]
                            ).properties(
                                title='Trend of actual incidents of trafficking in persons in Alberta from 2017 to 2021'
                            )
st.subheader('Actual Incidents')
st.altair_chart(actual_chart, use_container_width=True)
The Trend of the rate of trafficking in persons per 100,000 population in Alberta from 2017 to 2021

The above diagram portrays the trend of the rate of human trafficking per 100,000 population. This insight combined with the actual incidents rate in Alberta shows that there is an increase in Human trafficking victims in Alberta.
rate_per_100,000_chart = alt.Chart(data).mark_line().encode(
                          x=alt.X('REF_DATE:N', axis=alt.Axis(title='Year', labelAngle=0), sort=None),
                          y='Rate per 100,000 population',tooltip=[
                              alt.Tooltip('REF_DATE:N', title='Year'),
                              alt.Tooltip('Rate per 100,000 population', title='Rate per 100,000 population')
                          ]
                              ).properties(
                                  title='Trend of rate of trafficking in persons per 100,000 population in Alberta from 2017 to 2021'
                              )
st.subheader('Rate per 100,000 population')
st.altair_chart(rate_chart, use_container_width=True)
Percentage change in the rate of trafficking in persons in Alberta from 2017 to 2021
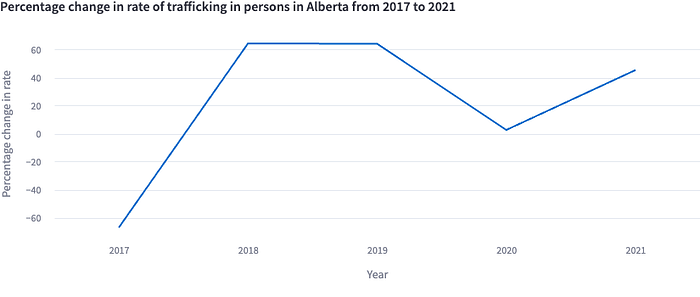
This shows the percentage change in the rate of actual incidents year over year.
percent_change_rate_chart = alt.Chart(data).mark_line().encode(
                            x=alt.X('REF_DATE:N',
                                    axis=alt.Axis(title='Year', labelAngle=0), sort=None),
                            y='Percentage change in rate',tooltip=[
                            alt.Tooltip('REF_DATE:N', title='Year'),
                            alt.Tooltip('Percentage change in rate', title='Percentage change in rate')
                              ]
                              ).properties(
                                  title='Percentage change in rate of trafficking in persons in Alberta from 2017 to 2021'
                              )
st.subheader('Percentage Change in Rate')
st.altair_chart(percent_chart, use_container_width=True)
Number of unfounded incidents of trafficking in persons in Alberta from 2017 to 2021
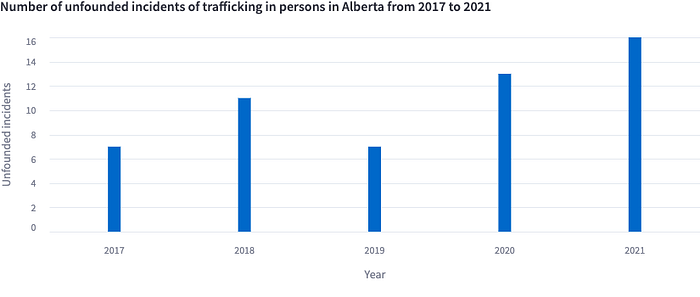
In human trafficking, “unfounded incidents” refer to reported human trafficking cases in which there is insufficient evidence to support the claims or claimed conduct does not comply with the legal definition of human trafficking. It is crucial to remember that fabricated occurrences shouldn’t diminish the importance of actual instances of human trafficking. Authorities and organizations must ensure that all reported cases are thoroughly investigated while providing protection and assistance to prospective victims. The urgent need to confront the widespread problem of human trafficking and help individuals who have been harmed should not be overshadowed by unfounded cases.
unfounded_incidents_chart = alt.Chart(data).mark_bar(size=15).encode(
                            x=alt.X('REF_DATE:N', axis=alt.Axis(title='Year', labelAngle=0), sort=None),
                            y='Unfounded incidents',tooltip=[
                            alt.Tooltip('REF_DATE:N', title='Year'),
                            alt.Tooltip('Unfounded incidents', title='Unfounded Incidents')
                              ]
                              ).properties(
                                  title='Number of unfounded incidents of trafficking in persons in Alberta from 2017 to 2021'
                              )
st.subheader('Unfounded Incidents')
st.altair_chart(unfounded_chart, use_container_width=True)
Conclusion
The final deliverable of our project was a Power BI dashboard developed by a team of volunteers. This dynamic dashboard integrates various publicly accessible datasets, providing an insightful and comprehensive overview of Human Trafficking trends in Alberta, as well as the broader context of Canada. Throughout our research, we discovered a significant disparity in reported figures across multiple agencies, with frontline organizations documenting substantially higher incidences of Human Trafficking than what is reflected in the publicly available statistics. Coupled with the fact that victims aren’t willing to come forward due to various reasons like the nature of the crime and their perception in society after they come forward, this disparity between reported incidents and actual incidents showcases the fact that we need to dedicate more resources, both human and material, to tackle this egregious issue.
The cooperation between Data for Good and Policywise and the sponsorship of Not In My City was crucial to the project’s success. By combining the knowledge of these organizations, we were able to create a dynamic tool that goes beyond statistics by combining the power of data science and policy insights. It encourages cooperation amongst various stakeholders, promoting a collective effort to stop human trafficking and assist survivors.
Being a volunteer at Data for Good has been a rewarding experience, especially creating a comprehensive dashboard for human trafficking in Alberta. By utilizing data for social good, we have taken a significant step in increasing awareness, enabling evidence-based decision-making, and fostering a more effective response to this serious issue. Together with Policywise and Not In My City, we are dedicated to using our knowledge to help abolish human trafficking, support survivors, and empower communities to effect long-lasting change.